By Mike Collopy, CFP®, CIMA®
The headlines continue to highlight the uncertainty and weakness of the economy. The list of reasons includes but is not limited to; inflation, mortgage rates, union strikes, our country’s divisive politics, China, war, and the list goes on. The path to economic recovery is not clear.
This uncertainty coupled with our human nature of being risk averse, drives the gut-checking question; should we move our portfolio to cash rather than taking risk in the equity markets? After all, cash and cash alternatives are paying 5% and that seems like a comfortable return compared to the risk-free perception.
Due to several factors outlined below, we don’t believe shifting a portfolio to cash is the optimal choice, unless there have been unique changes to your circumstances and time horizon. Outlined here, are several factors driving us to stay invested.
- Reinvestment Risk
- Market Timing Risks
- Probability of Higher Returns
- Impact of Inflation on Returns
Reinvestment Risk
This risk is that you may not be able to achieve comparable rates when it comes time to reinvest. Cash and cash alternatives (like money market funds), provide predictable returns but only for the short term. We may enjoy collecting our 5% now, but over the next 12 months, rates could move lower, creating reinvestment risk. We’ve seen environments like this before.
In 2006, yields in the US treasury market were inverted, with short-term treasuries paying more than longer-term treasuries. As shown in Figure 1, a 2-year treasury note yielded 4.75%, while a 10-year treasury note yielded 4.6%. If you purchased the two-year note you would have faced the reinvestment risk dilemma in 2008, when the yield on a new 2-year treasury was 1.22% and the 10-year yield was 3.68%. You locked in 4.75% for 2 years but are now stuck with lower rates. In fact, if we compared returns of continually purchasing 2-year notes versus a 10-year note, the 10-year note outperformed by 3.14%, per year!

Purchasing a short-term bond yielding 5% is a good option if it’s part of your allocation to bonds or if you need the proceeds in the short-term but if not, you are taking on reinvestment risk.
Marketing Timing Risk
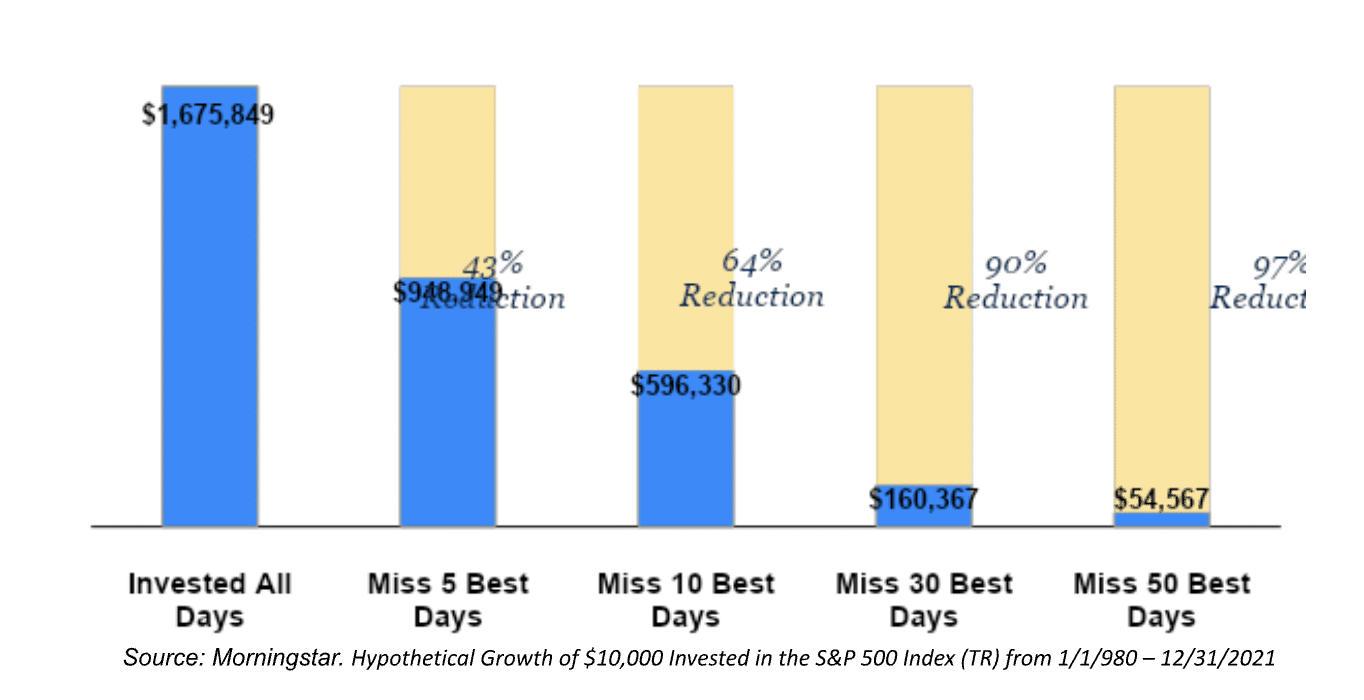
While we want to be aligned with the winning trend, making drastic portfolio shifts includes several risks that we’ve seen consistently lead to underwhelming long-term results. Below is an example of an investor that missed the top return days in the S&P 500, since 1980. Just missing the 5 best days reduced their portfolio value by 43%. Realistically, if you attempted to time the market and missed 5 of the best days, you may have also missed some of the worst days. But I think a more important takeaway is the power of compounding and how missing a market upswing can setback the growth of your wealth.

Marketing timing based on inaccurate predictions is a common culprit to long-term underperformance, as we saw in 2020. The fear of a COVID slowdown far outweighed the potential positive market impacts from rates and stimulus. To the surprise of many, the markets rallied through 2020 and 2021. There was a similar risk appetite (or lack of) coming out of the Global Financial Crisis in 2009. Missing these surge periods for equity markets can impact our long-term returns but it also makes it that much tougher to get back into the market as we feel we’ve missed the upside.
Probability of Higher Returns
Allocating investments according to your goals (like future cash flow needs) is an effective approach. Commonly, financial advisors use tools, such as a Monte Carlo simulation, to implement this process. This process can help you target the right mix of stocks, bonds, real assets, and other asset classes, to achieve your spending goals. For example, you wouldn’t invest your home down payment money into Nasdaq stocks because over the short-term you could realize a sizable loss, which could have a major impact on the home you can afford. But you may want a portion of your retirement savings invested in Nasdaq stocks as the time horizon is longer. The Monte Carlo is one tool to help quantify the goals, the risk, and create the right mix.
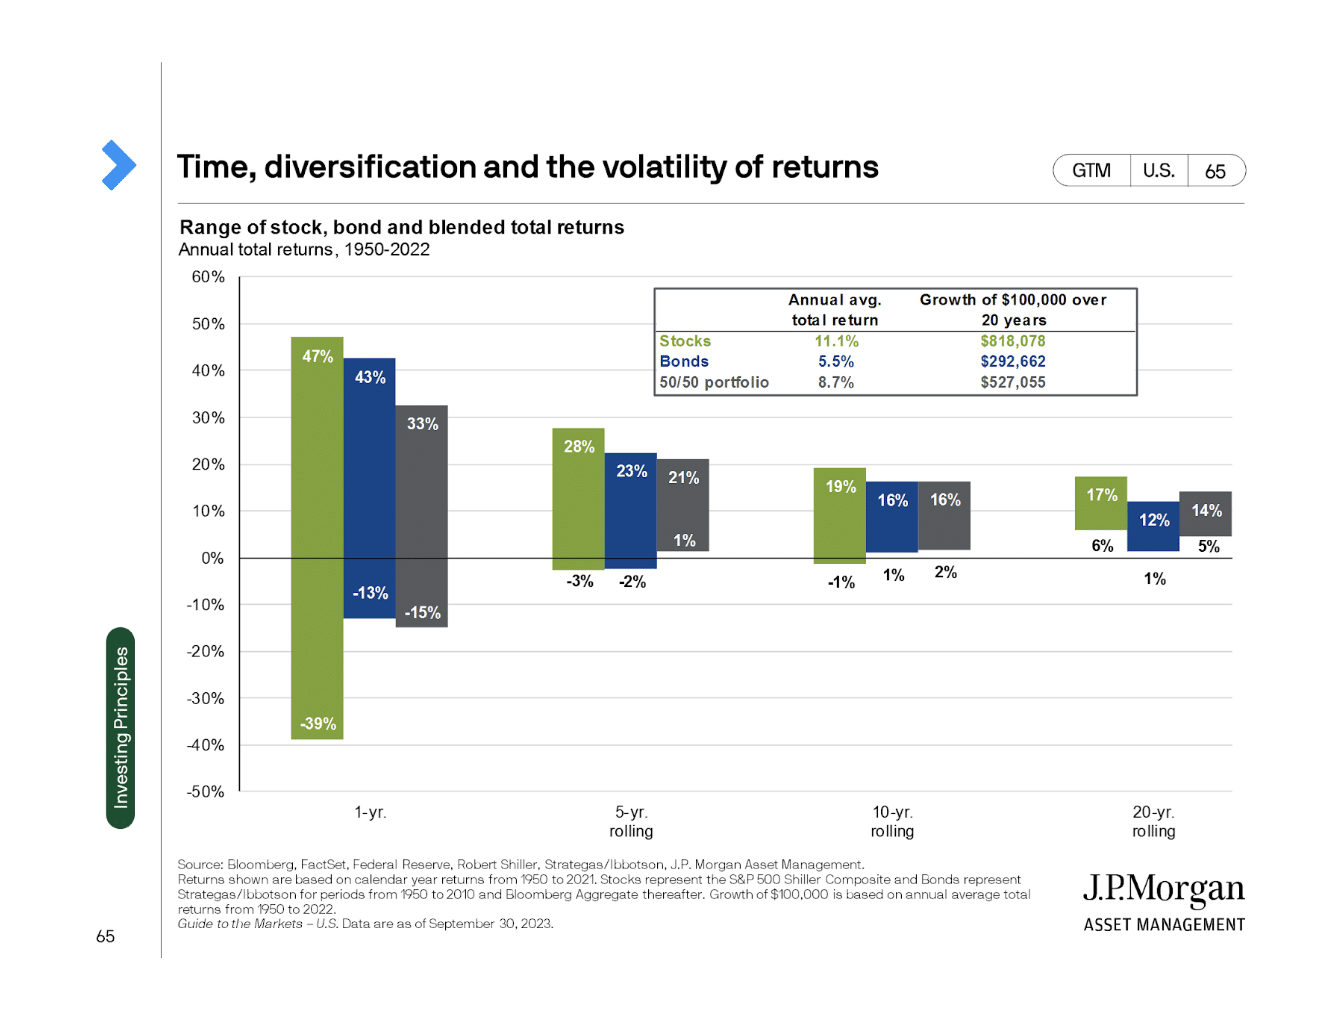
The below chart outlines stock, bond, and balanced portfolio returns over different time periods. As shown, there had never been a 10-year period where a 50/50 portfolio had a loss. Quantifying the risk helps us make more informed decisions about allocation and should help set return expectations.

Inflation
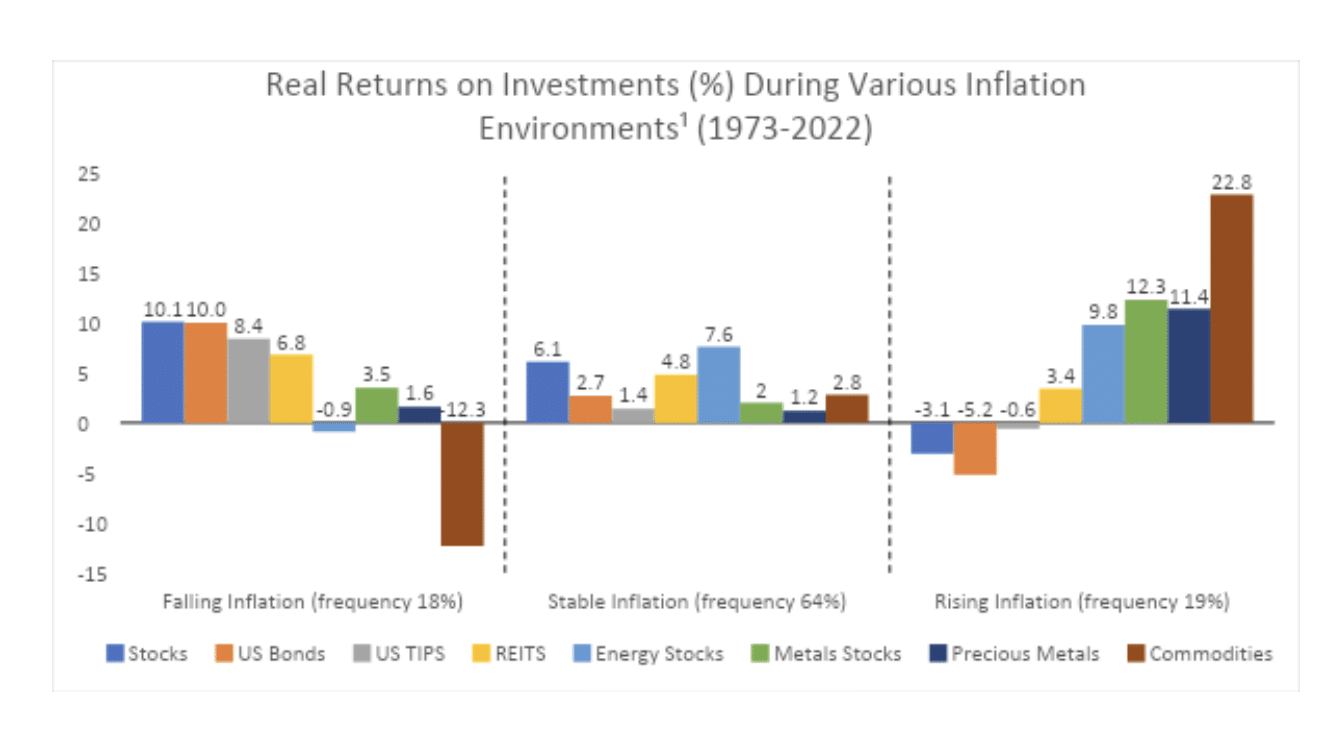
Inflation can be a portfolio killer. The below looks at real returns (returns after factoring in the impact of inflation).
As illustrated, 80% of the time, we’re in a falling or stable inflationary environment. During that 80% of the time, equities stand out as providing a strong real return and most other asset classes do well too. However, in rising inflationary environments, real assets historically have provided the best real returns. The challenge is shifting a portfolio, meaningfully, into real assets from equities and bonds. There is friction, potential tax consequences, complexities about which funds to use, timing risk, and more. So, yes real assets provided a strong hedge during inflationary environments (historically) and that’s why we believe they should normally be part of a portfolio in any environment. Equities are seen as a long-term inflation hedge as they do well in most inflationary environments and companies can insulate earnings by passing higher costs along to customers.

Final Note
A core tenant of our investment framework is that investment decisions should be made in the context of personal spending goals. While cash and cash alternatives are an attractive option relative to the past decade of low rates, long-term returns expectations are still higher for equity investments. Having more cash may create a greater sense of comfort now but may lead to lower performance and less comfort down the road if your financial plan falls behind. This is not advocating for a bull market or excess expected returns, it is rather a reminder to focus on the big picture, aligning goals with investments, and looking at the probabilities of long-term returns.
For more information, please contact any of the professionals at Veracity Capital.
About Michael
Mike Collopy is wealth advisor and partner at Veracity Capital. As a fiduciary who puts his clients’ interests first, always, Mike is known for providing a holistic perspective on his clients’ finances. His comprehensive process first looks at the big picture of each client’s family, health, and wealth, then drills down to provide solutions for their financial needs, concerns, and goals. He’s passionate about the science of financial planning and investing and uses that to help his clients build a strong foundation for their financial life. Mike serves career-driven individuals who need professional advice to manage their wealth and maximize their opportunities, such as corporate benefits and complicated compensation packages. He considers his clients to be like family, and strives to support them and their families as they work hard for their financial future.
Mike has a bachelor’s degree in finance from Coastal Carolina University and an MBA from The College of Saint Rose. He is also a CERTIFIED FINANCIAL PLANNER™ practitioner and a Certified Investment Management Analyst®. When he’s not working, you can find Mike spending time with his wife and young son, often exploring the great outdoors by hiking or enjoying the beach. He likes to stay active, playing basketball and training for half marathons. Mike gives back to the community by supporting organizations dedicated to finding treatments for cystic fibrosis. To learn more about Mike, connect with him on LinkedIn.
Advisory services offered through Veracity Capital, LLC, a registered investment advisor. Information presented is for educational purposes only and does not intend to make an offer or solicitation for the sale or purchase of any specific securities, investments, or investment strategies. Investments involve risk and, unless otherwise stated, are not guaranteed. Be sure to first consult with a qualified financial advisor and/or tax professional before implementing any strategy discussed herein. Past performance is not indicative of future performance.
This performance report provides information regarding the accounts managed by Veracity Capital, LLC, in accordance with your investment objectives. You should communicate any changes to your current investment objectives or financial condition to Veracity Capital, LLC.
Past performance is not indicative of future performance. Principal value and investment return will fluctuate. No guarantees or assurances that the target returns will be achieved, or objectives will be met, are implied. Future returns may differ significantly from past returns due to many different factors. Investments involve risk and the possibility of loss of principal. The values and performance numbers represented in this report do not reflect management fees. The values used in this report were obtained from sources believed to be reliable. Veracity Capital, LLC, calculated performance numbers using data provided. Please consult your custodial statements for an official record of value.
This information may be taken, in part, from external sources. We believe these external sources to be reliable, but no warranty is made as to accuracy. This material is not financial advice or an offer to sell any product. There is no guarantee of the future performance of any Veracity Capital, LLC, portfolio. The investment strategies discussed may not be suitable for all investors. Before investing, consider your investment objectives and Veracity Capital, LLC, charges and expenses. All investment strategies have the potential for profit or loss.
Benchmarks: The index / indices used by Veracity Capital, LLC, have not been selected to represent an appropriate benchmark to compare an investor’s performance, but rather are disclosed for informational purposes. Detailed information regarding the indices is available upon request. The volatility of the indices may be materially different than that of the portfolio.
Veracity Capital, LLC, is a registered investment advisor. Registration does not imply a certain level of skill or training. More information about Veracity Capital, LLC, including its advisory services and fee schedule, can be found in Form ADV Part 2 which is available upon request.
¹Real Returns on Investments (%) During Various Inflation Environments:
Period analyzed is January 1973 through December 2022. Real returns are based on US CPI. REIT data set begins in 1993, corresponding with the advent of the modern REIT era. Stocks: MSCI World Index. US Bonds: Bloomberg US Aggregate Index since January 1976; Bloomberg US Government Bond Index from January 1973 to December 1975. US TIPS: Bloomberg US TIPS 1-10 Year Index since March 1997. Prior to March 1997, the data is based on Wellington Management’s internal TIPS model. Real Estate: MSCI World Real Estate Index since January 1993. Energy: MSCI World Energy Index since January 1995; DataStream World Energy Index from January 1973 to December 1994. Metals & Mining: MSCI World Metals & Mining Index since January 1995; DataStream World Metals & Mining Index from January 1973 to December 1994. Commodities: Equal Sector Weighted S&P Goldman Sachs Commodities Index. Precious Metals: 70% MSCI World Gold Mining Equity Index/30% S&P GSCI Precious Metals Precious Metals Commodities Total Return Index since January 2005; 70% DataStream World Gold Mining Index/30% S&P GSCI Precious Metals from January 1973 to December 2004. A rising inflation period is defined as any month when Y/Y US CPI rose by 0.3% or more relative to the previous month; a stable inflation period is defined as any month when Y/Y US CPI was between -0.3% and +0.3% relative to the previous month, a falling inflation period is defined as any month when Y/Y US CPI fell by -0.3% or more relative to the previous month. Past performance does not predict future returns.

